fbpx
R&D

SurveyLink
Field Installation Simplified

As projects increase in complexity, collaboration between design and construction teams is critical to success. Early in the design process many tools of collaboration and coordination exist, like collaborative redlining in Bluebeam Studio or cloud-based modeling platforms, but on the job site teams are fragmented.

Over the last 30 years Zahner has delivered hundreds of the world’s most iconic and challenging buildings. Zahner often develops software tools to analyze survey (or pointcloud) information and as-built conditions, but these computational patches only speed Zahner’s analysis portion and don’t address larger multi-trade coordination.  To address this problem, the Zahner Labs team has created SurveyLinka real-time data link between as-designed 3D models and as-built data collected in the field (Figure 1).

SurveyLink offers the same transformative potential to field crews that 3D modeling brought to design professionals in the office. The streamlined delivery method improves productivity by eliminating unnecessary remobilization of field crews and reduces the lengthy review periods typically associated with construction administration.

Key Benefits:

  • Improved quality
  • Lower construction costs
  • Streamlined conflict resolution
  • Safer job sites
  • Expedited lean construction

As a project moves from the office to the job site, the tools for design and coordination diminish in sophistication and accessibility (Figure 2). In the design phase, architects and design engineers wield a suite of tools for computational modeling, finite element analysis (FEA), simulation, data sharing and 3D computer-aided design (CAD) visualization. Whereas when construction begins their counterparts on the job site operate with 2D documents, tape measures, levels, string, and occasionally surveying tools such as a Total Station.

When a project is complex and changes from one inch to the next, 2D documents are not comprehensive, resulting in much of the construction left up to interpretation. This leads to discrepancies between the as-designed 3D model and the as-built physical construction. This is further complicated when the design engineers responsible are located in offices geographically far from the construction site (Figure 3).

Figure 1: SurveyLink. On-site data streamed directly from Total Station to a web-based, collaborative 3D model.

Figure 1: SurveyLink. On-site data streamed directly from Total Station to a web-based, collaborative 3D model.

Figure 2: Typical project data flow.

Figure 2: Typical project data flow.

Figure 3: Current State—inefficient and expensive data exchange "loops" between office and field.

Figure 3: Current State—inefficient and expensive data exchange "loops" between office and field.

R&D

SurveyLink
Field Installation Simplified

As projects increase in complexity, collaboration between design and construction teams is critical to success. Early in the design process many tools of collaboration and coordination exist, like collaborative redlining in Bluebeam Studio or cloud-based modeling platforms, but on the job site teams are fragmented.

Over the last 30 years Zahner has delivered hundreds of the world’s most iconic and challenging buildings. Zahner often develops software tools to analyze survey (or pointcloud) information and as-built conditions, but these computational patches only speed Zahner’s analysis portion and don’t address larger multi-trade coordination.  To address this problem, the Zahner Labs team has created SurveyLinka real-time data link between as-designed 3D models and as-built data collected in the field (Figure 1).

Figure 1: SurveyLink. On-site data streamed directly from Total Station to a web-based, collaborative 3D model.

Figure 1: SurveyLink. On-site data streamed directly from Total Station to a web-based, collaborative 3D model.

SurveyLink offers the same transformative potential to field crews that 3D modeling brought to design professionals in the office. The streamlined delivery method improves productivity by eliminating unnecessary remobilization of field crews and reduces the lengthy review periods typically associated with construction administration.

Key Benefits:

  • Improved quality
  • Lower construction costs
  • Streamlined conflict resolution
  • Safer job sites
  • Expedited lean construction
Figure 2: Typical project data flow.

Figure 2: Typical project data flow.

As a project moves from the office to the job site, the tools for design and coordination diminish in sophistication and accessibility (Figure 2). In the design phase, architects and design engineers wield a suite of tools for computational modeling, finite element analysis (FEA), simulation, data sharing and 3D computer-aided design (CAD) visualization. Whereas when construction begins their counterparts on the job site operate with 2D documents, tape measures, levels, string, and occasionally surveying tools such as a Total Station.

When a project is complex and changes from one inch to the next, 2D documents are not comprehensive, resulting in much of the construction left up to interpretation. This leads to discrepancies between the as-designed 3D model and the as-built physical construction. This is further complicated when the design engineers responsible are located in offices geographically far from the construction site (Figure 3).

Figure 3: Current State—inefficient and expensive data exchange "loops" between office and field.

Figure 3: Current State—inefficient and expensive data exchange "loops" between office and field.

See it in action

Explore SurveyLink™ Webinar

Real-Time Calibration During Installation of Complex Structures

June 23, 2021, 11:00 a.m. CDT

See a demonstration of how it works in real-time during the webinar.

You’ll discover:

  • How SurveyLink expedites traditional survey processes
  • How remote stakeholders can follow along/guide job site activities
  • How 3D models can guide the installation (position & orientation) of parts in the field via real-time comparison
  • How to place components in the right place the first time

SurveyLink provides a real-time data link—the same information available to all stakeholders, accessible from anywhere.

Problems with the status quo

Current communication methods such as emailing PDFs, spreadsheets, verbal descriptions, mobile phone photos, text messages and hand-drawn sketches are insufficient in conveying a complete picture of onsite conditions.

This separation of parties has a two-pronged effect: design engineers and architects in the office don’t have eyes on what is being done at the job site and the field crew doesn’t have a full picture of what they are producing. This results in review and revise iterative “loops” and expensive rework. The industry needs a new approach.

As points are measured and streamed by Total Station, their positions are compared to individual (local) coordinate systems. Deviations are calculated and displayed for instantaneous feedback. Simply "zero out" values to locate elements.

As points are measured and streamed by Total Station, their positions are compared to individual (local) coordinate systems. Deviations are calculated and displayed for instantaneous feedback. Simply "zero out" values to locate elements.

Key: The active point is the most recent time-stamped point streamed from the Total Station—it is measured against the corresponding target plane.

Key: The active point is the most recent time-stamped point streamed from the Total Station—it is measured against the corresponding target plane.

Each person viewing the model in a SurveyLink collaborative session is also able to see what their colleagues are looking at and where they are pointing for remote coordination. Click the graphic above to explore a live SurveyLink session.

3D models accessible from anywhere

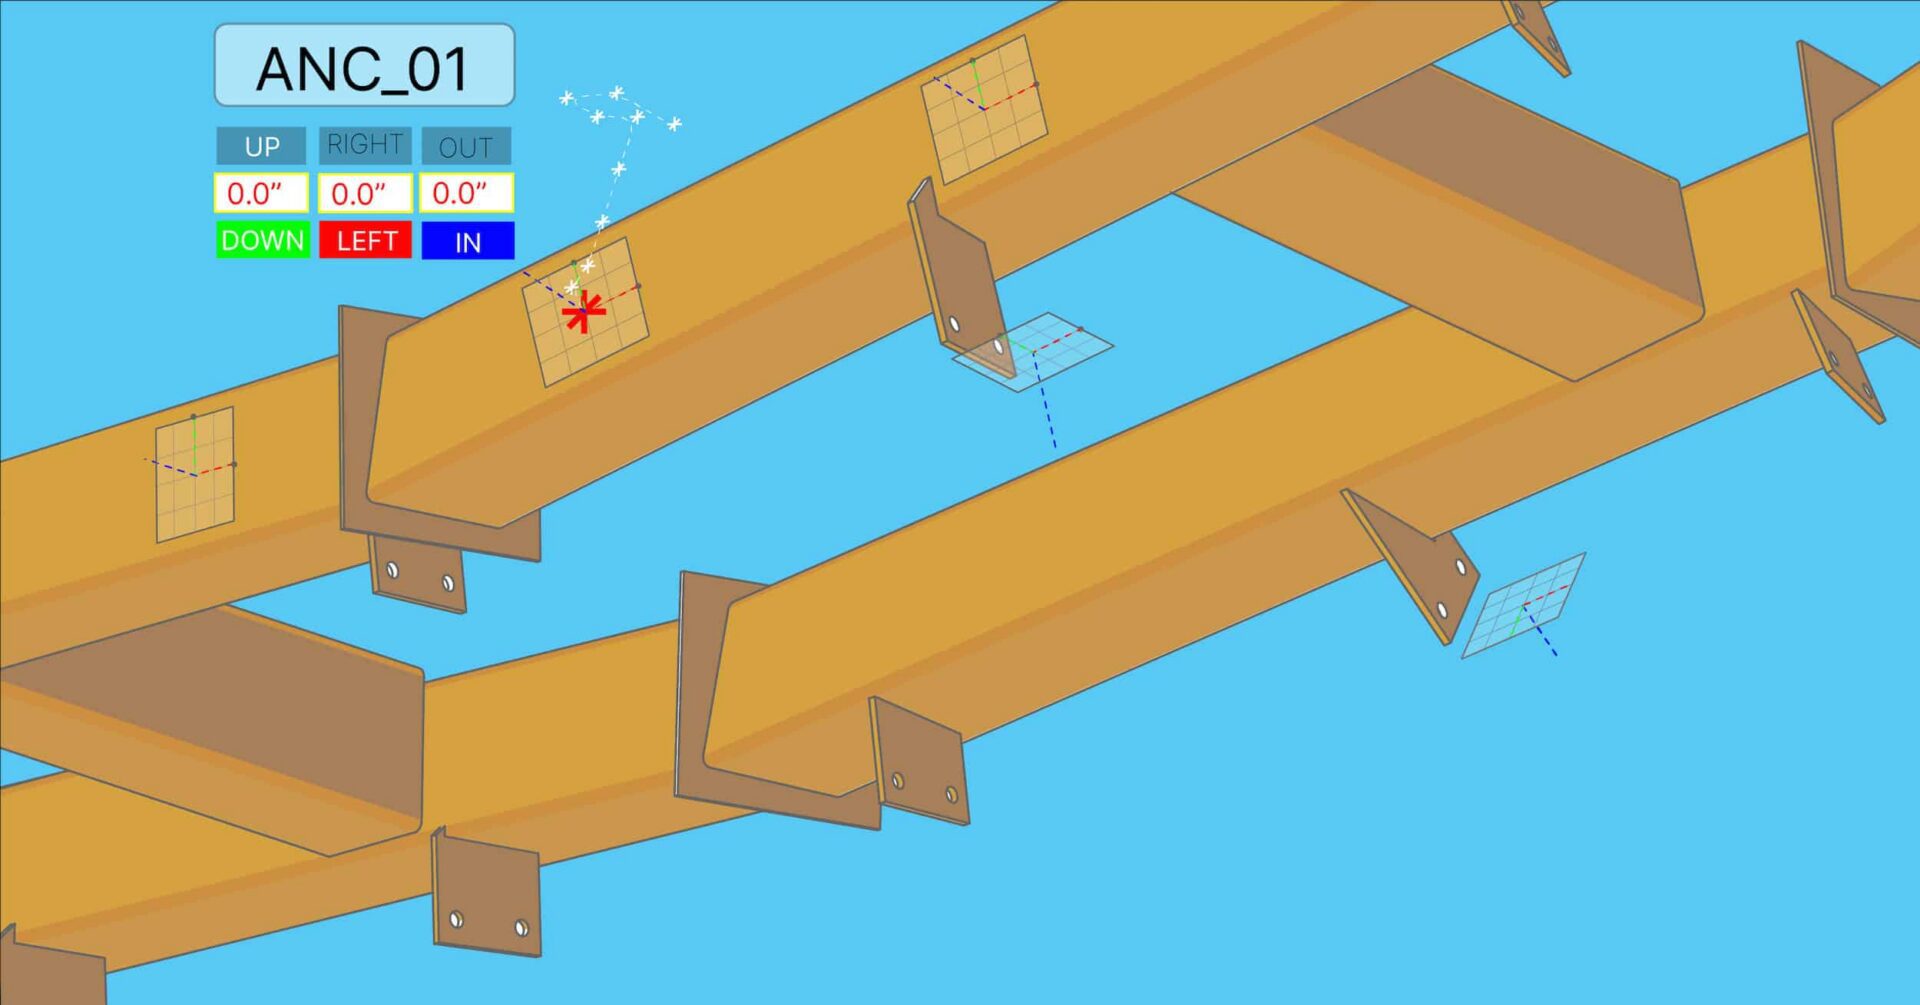
With SurveyLink, on-site survey crews upload captured coordination point data to a collaborative model. SurveyLink provides cloud storage and collaborative CAD/BIM visualizations. Connected users can instantly access and see positional deviations between the as-designed and as-built coordination points in 3D using a lightweight web application.

As newly shot survey data is uploaded, deviation values are automatically updated on the model and available to everyone involved in the project. PDF reports and mobile phone photos are replaced by 3D visualizations that can be interacted with simultaneously by field crews on their mobile device and design engineers, or project managers, on whatever device they choose.

Mobile-accessible cloud storage allows survey crews working on site to access and upload new data at any time, solving the communication issues that arise from geographically distributed teams. Field crews are seeing the same three-dimensional data on their mobile devices that the design engineers are viewing in the office. SurveyLink is in essence a tool that eliminates fragmented communication between the office and job site—in real time, in 3D, on mobile devices, and in the browser.

Illustration of SurveyLink data ubiquity between all project stakeholders.

Illustration of SurveyLink data ubiquity between all project stakeholders.

Signup and we’ll show you how it all works (no surveying knowledge required).

Example of a complex Zahner field installation at The Petersen Automotive Museum in Los Angeles, designed by KPF.

Example of a complex Zahner field installation at The Petersen Automotive Museum in Los Angeles, designed by KPF.